Iris Baumann · 10 October 2026
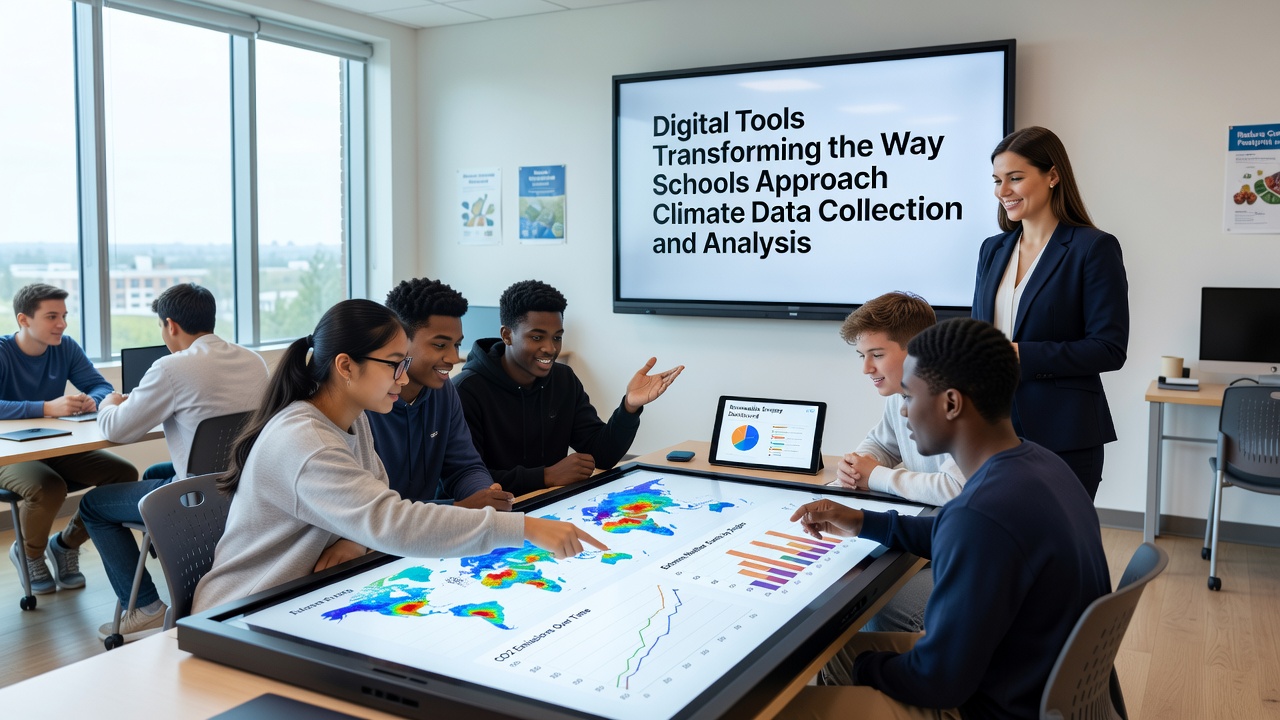
Digital Tools Transforming the Way Schools Approach Climate Data Collection and Analysis
Schools worldwide have integrated digital tools into climate monitoring programs over the past decade, shifting from manual recordings with basic thermometers toward networked sensors and cloud-based platforms that capture temperature, precipitation, air quality, and biodiversity metrics in real time. These systems allow students to upload readings directly from handheld devices while automated stations log continuous streams of environmental variables, creating datasets that extend beyond single classroom sessions and connect with regional databases maintained by government agencies.
Core Technologies Driving School-Based Climate Monitoring
Internet of Things sensors now form the backbone of many educational climate projects, transmitting data on soil moisture, carbon dioxide levels, and wind patterns through wireless networks that feed into school servers or public repositories. Mobile applications paired with these devices enable students to tag observations with GPS coordinates and timestamps, while software dashboards visualize trends through interactive graphs and maps that update as new inputs arrive. Researchers at various institutions have documented how platforms such as Google Earth Engine and open-source alternatives process satellite imagery alongside ground-level measurements, helping schools compare local conditions against broader regional patterns documented by agencies like the U.S. Environmental Protection Agency.
Artificial intelligence components embedded in analysis tools sort through large volumes of student-collected information, identifying anomalies in temperature spikes or rainfall distribution that might otherwise require hours of manual review. In October 2026 several school networks reported expanded use of these AI-assisted features following updates to open data portals that standardized formatting across different sensor brands, reducing compatibility issues that previously slowed collaborative projects between districts in different states.
Implementation Patterns Across Educational Settings
Urban schools often deploy compact air quality monitors on rooftops and link them to classroom computers for daily analysis sessions, whereas rural programs emphasize weather stations that track agricultural variables such as humidity and solar radiation. Both approaches rely on the same underlying data pipelines, which export readings in formats compatible with spreadsheet programs and statistical packages used in secondary science curricula. Observers note that partnerships with universities have supplied calibration protocols ensuring sensor accuracy meets standards referenced in reports from Environment and Climate Change Canada.
One documented case involved a Midwestern district that combined student-collected precipitation data with publicly available radar archives, revealing localized flooding risks not captured in coarser national models. The project generated time-series charts shared through school websites, allowing community members to review patterns alongside official forecasts from the National Oceanic and Atmospheric Administration. Similar efforts in European classrooms have incorporated low-cost particulate sensors, feeding readings into EU-wide environmental databases maintained under directives from the European Environment Agency.
Data Analysis Workflows and Student Engagement
Analysis begins with basic filtering steps that remove outliers caused by equipment malfunctions or user error, followed by aggregation routines that calculate monthly averages and seasonal deviations. Visualization software then renders these summaries as heat maps or trend lines that students annotate with contextual notes about nearby construction or seasonal vegetation changes. Teachers report that these workflows align with existing mathematics and geography standards, allowing climate data exercises to count toward multiple subject requirements without additional scheduling.
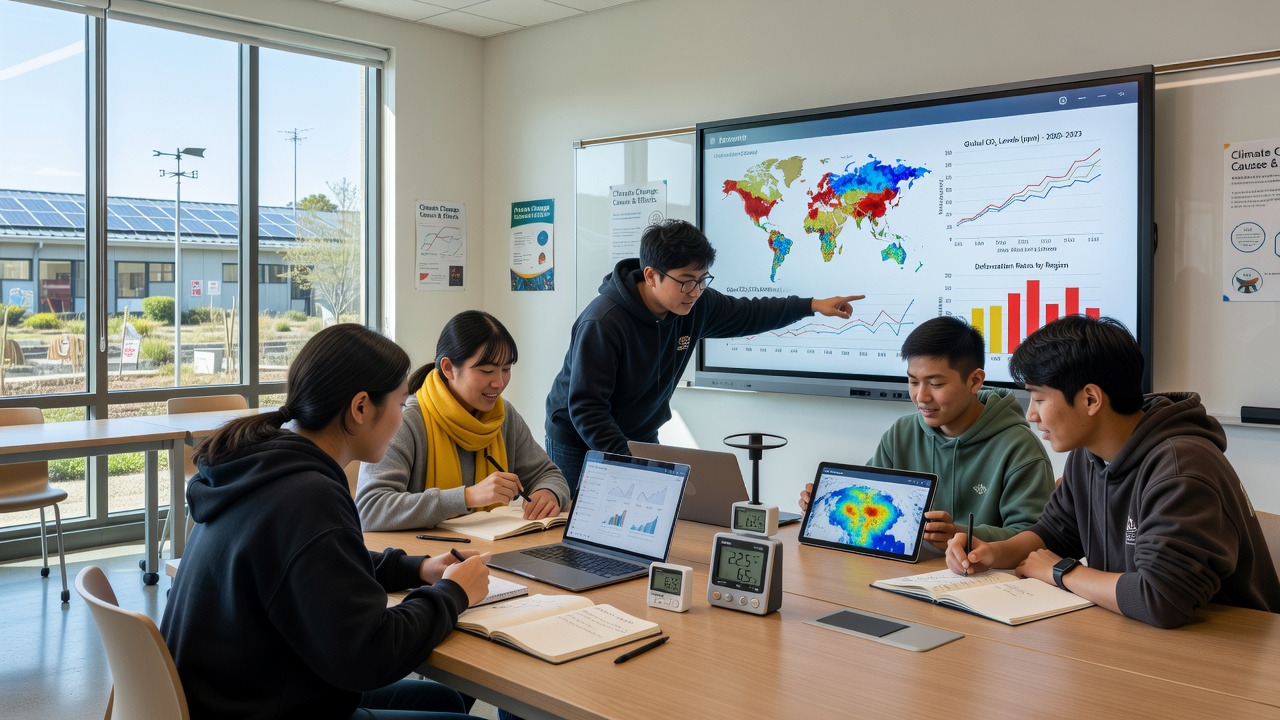
Cross-school comparisons have become routine through shared cloud folders where participants upload anonymized datasets for joint review. A study published by researchers at the University of Melbourne examined how such exchanges improved spatial understanding among participants, noting that students who reviewed data from partner schools in different climate zones identified correlations between elevation and temperature ranges more quickly than control groups using only textbook examples. These collaborative layers add depth without requiring travel or physical exchanges.
Challenges in Scaling and Maintaining Accuracy
Calibration drift in low-cost sensors remains a recurring issue, prompting many programs to schedule quarterly checks against reference instruments borrowed from local meteorological offices. Data privacy protocols require removal of precise location tags before uploads to public repositories, while still preserving enough geographic context for meaningful spatial analysis. Funding for ongoing maintenance varies widely, with some districts relying on grant cycles that cover hardware replacement every three to five years.
Training for educators focuses on interpreting error margins and understanding how sampling frequency affects trend reliability, skills reinforced through online modules offered by scientific societies. As of late 2026, several state education departments had begun incorporating climate data literacy benchmarks into science assessments, reflecting the growing presence of these tools in standard curricula.
Conclusion
Digital platforms continue to expand the scope of school climate projects by linking individual measurements to larger datasets and analytical methods previously reserved for professional research teams. The combination of affordable sensors, accessible software, and standardized sharing protocols supports consistent data collection across diverse geographic and economic contexts, while ongoing refinements in calibration and training address persistent technical hurdles. Reports from multiple agencies indicate sustained growth in participation rates through 2026, driven by alignment with existing educational goals rather than standalone environmental initiatives.